

Ethereum’s price has seen a significant drop recently.
If you’re following the crypto market, you might have noticed ETH moving downwards for a couple of weeks.
It reached around $1,645, a level not seen since last October.
This means its value decreased quite a bit, more than 60%, from its peak back in December of the previous year.
Let’s break down what some market signals might suggest.
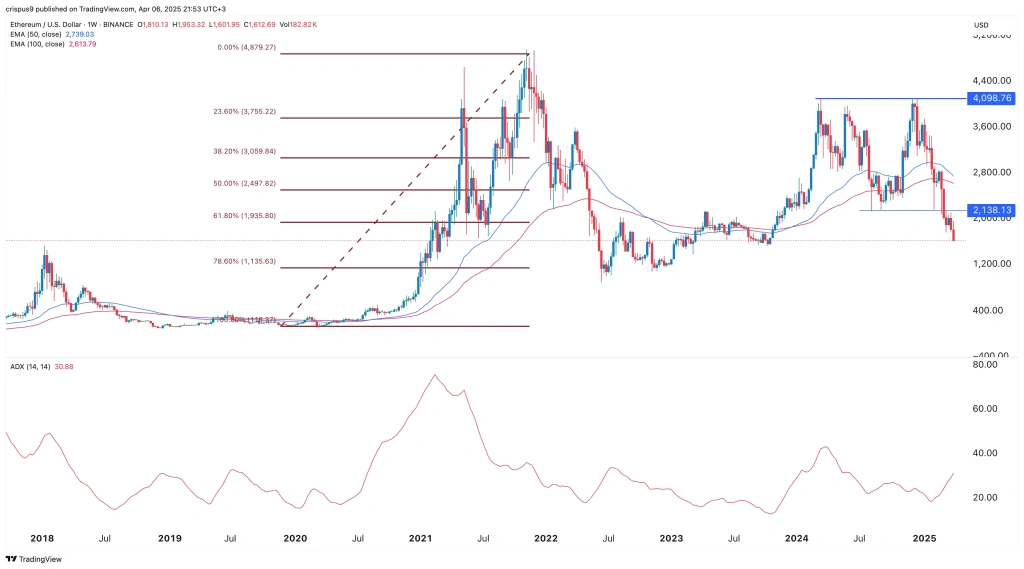
Looking at the longer-term picture (like a weekly chart), we can see this downward slide more clearly.
After hitting a high near $4,098, Ethereum’s value has indeed fallen substantially.
Market analysts often look for patterns.
One pattern noticed was a “triple-top” around that $4,098 mark.
Think of this like the price trying three times to push higher but failing, which sometimes suggests a potential move lower.
There was a key price level, around $2,140, acting like a floor (or “support”). The price has now dropped below this level.
Another tool traders use is called Fibonacci Retracement.
Don’t worry too much about the name.
it’s basically a way to identify potential support or resistance levels based on previous price swings.
ETH fell below a significant one of these levels ($1,935), sometimes called the “golden ratio,” which often acts as a point where price bounces might happen.
Breaking below it can indicate stronger downward pressure.
You might also hear about Moving Averages (like the 50-week and 100-week EMAs).
These are essentially smoothed-out price lines that help show the overall trend direction.
Ethereum has dipped below these long-term averages, again suggesting a weakening trend.
Other indicators, like the RSI and Stochastic Oscillator, which help gauge if an asset is potentially “overbought” or “oversold,” are also pointing downwards currently.
An indicator called the ADX, which measures how strong a trend is (up or down), has risen above 20 and is pointing up.
In this context, it suggests the current downward trend is gaining strength.
What Could This Mean?
Based on these technical signals, some analysts believe Ethereum’s price might continue to face downward pressure.
They are watching levels like $1,500 and even $1,000 as potential next floors (“support”) where the price might stabilize if it keeps falling.
It’s important to remember: crypto markets are famously volatile.
These indicators and patterns offer clues, but they aren’t guarantees. Many factors influence price.
If the price were to bounce back strongly and go above $2,138 (that previous floor, now a potential ceiling or “resistance”), it could signal that the immediate downward pressure is easing.
Also read: Crypto Taxation in Pakistan: What 9 Million Traders Need to Know
Market Sentiment: Feeling Fearful?
The overall mood in the crypto market also plays a big role.
An indicator called the “Crypto Fear & Greed Index” has been low (in the “fear” zone).
Think of this like a market mood ring. When it shows extreme fear, it means many investors are worried.
Interestingly, sometimes (but not always!), widespread fear can eventually lead to buying opportunities for long-term investors, while extreme greed might signal the opposite.
It’s just one piece of the puzzle.
We’ve also seen that investors seem slightly less interested in altcoins (like Ethereum) compared to Bitcoin lately.
Even the traditional stock market has shown signs of “extreme fear.”
When big investors get nervous overall, they might pull money out of assets perceived as riskier, including crypto.
This might explain why some investment products like spot ETH ETFs (funds that hold Ethereum) have seen money flowing out recently.
Broader economic factors, like global trade discussions, can also impact crypto prices, though it’s often hard to predict exactly how.
What Should You Consider?
Seeing prices drop can be unsettling, especially if you’re new.
Instead of trying to perfectly time the market based on complex charts (which even experts find difficult!), focus on learning.
Understand the fundamentals of Ethereum.
what is it, how does it work, what gives it potential value?
Learn about risk management. Never invest more than you can afford to lose.
Look for reliable, educational resources to build your knowledge base. Be cautious of hype or promises of quick riches.
Market dips can be viewed as opportunities to learn and potentially acquire assets at lower prices if you believe in their long-term potential and have a solid plan.
How does this current market situation make you feel about Ethereum’s future? Share your thoughts in the comments below!
Key Takeaways:
- Ethereum (ETH) price has experienced a significant downward trend, falling over 60% from its previous peak.
- Technical indicators like chart patterns (triple-top), moving averages, and momentum oscillators (RSI, ADX) suggest continued downward pressure, with analysts watching $1,500 and $1,000 as potential support levels.
- Market sentiment is currently fearful, as shown by the Fear & Greed Index and outflows from ETH investment products, reflecting broader investor caution.
- For beginners, understanding market volatility, focusing on learning Ethereum fundamentals, practicing risk management, and finding reliable resources is crucial when navigating price drops.
- External factors and overall market mood also play a significant role in crypto price movements alongside technical analysis.